


























About Shareholder Returns
We regard returning profits to shareholders through dividends as one of our most important management priorities. We pay dividends at the higher of the following two amounts: a consolidated dividend payout ratio of 65% or more, or a dividend on equity (DOE) of 4%, calculated based on shareholders' equity excluding foreign currency translation adjustments.
In addition, depending on our business performance, we will strive to enhance shareholder returns while giving consideration to optimal capital allocation, such as by conducting share buybacks.
Dividends
| Fiscal Year | Payout Ratio | Dividend per Share (yen) | Earnings per Share (yen) |
|---|---|---|---|
| FY2026 * (forecast) | 65.0% | 59.61 | 91.70 |
| FY2025 | 65.0% | 56.91 | 87.55 |
| FY2024 * | 50.2% | 37.22 | 74.22 |
| FY2023 | 59.9% | 38.46 | 64.21 |
| FY2022 | 53.1% | 39.06 | 73.51 |
| FY2021 | 80.1% | 33.64 | 41.98 |
| FY2020 | 50.0% | 50.81 | 101.62 |
| FY2019 | 50.0% | 46.59 | 93.18 |
| FY2018 | 50.0% | 41.52 | 83.04 |
| FY2017 | 50.0% | 27.60 | 55.17 |
| FY2016 * | 50.0% | 21.25 | 42.47 |
* Share buybacks were conducted during the fiscal year.
Share Buybacks
| Fiscal Year | Shares Acquired (shares) | Acquisition Amount |
|---|---|---|
| FY2026 | 11,900 | 26,660,700 yen |
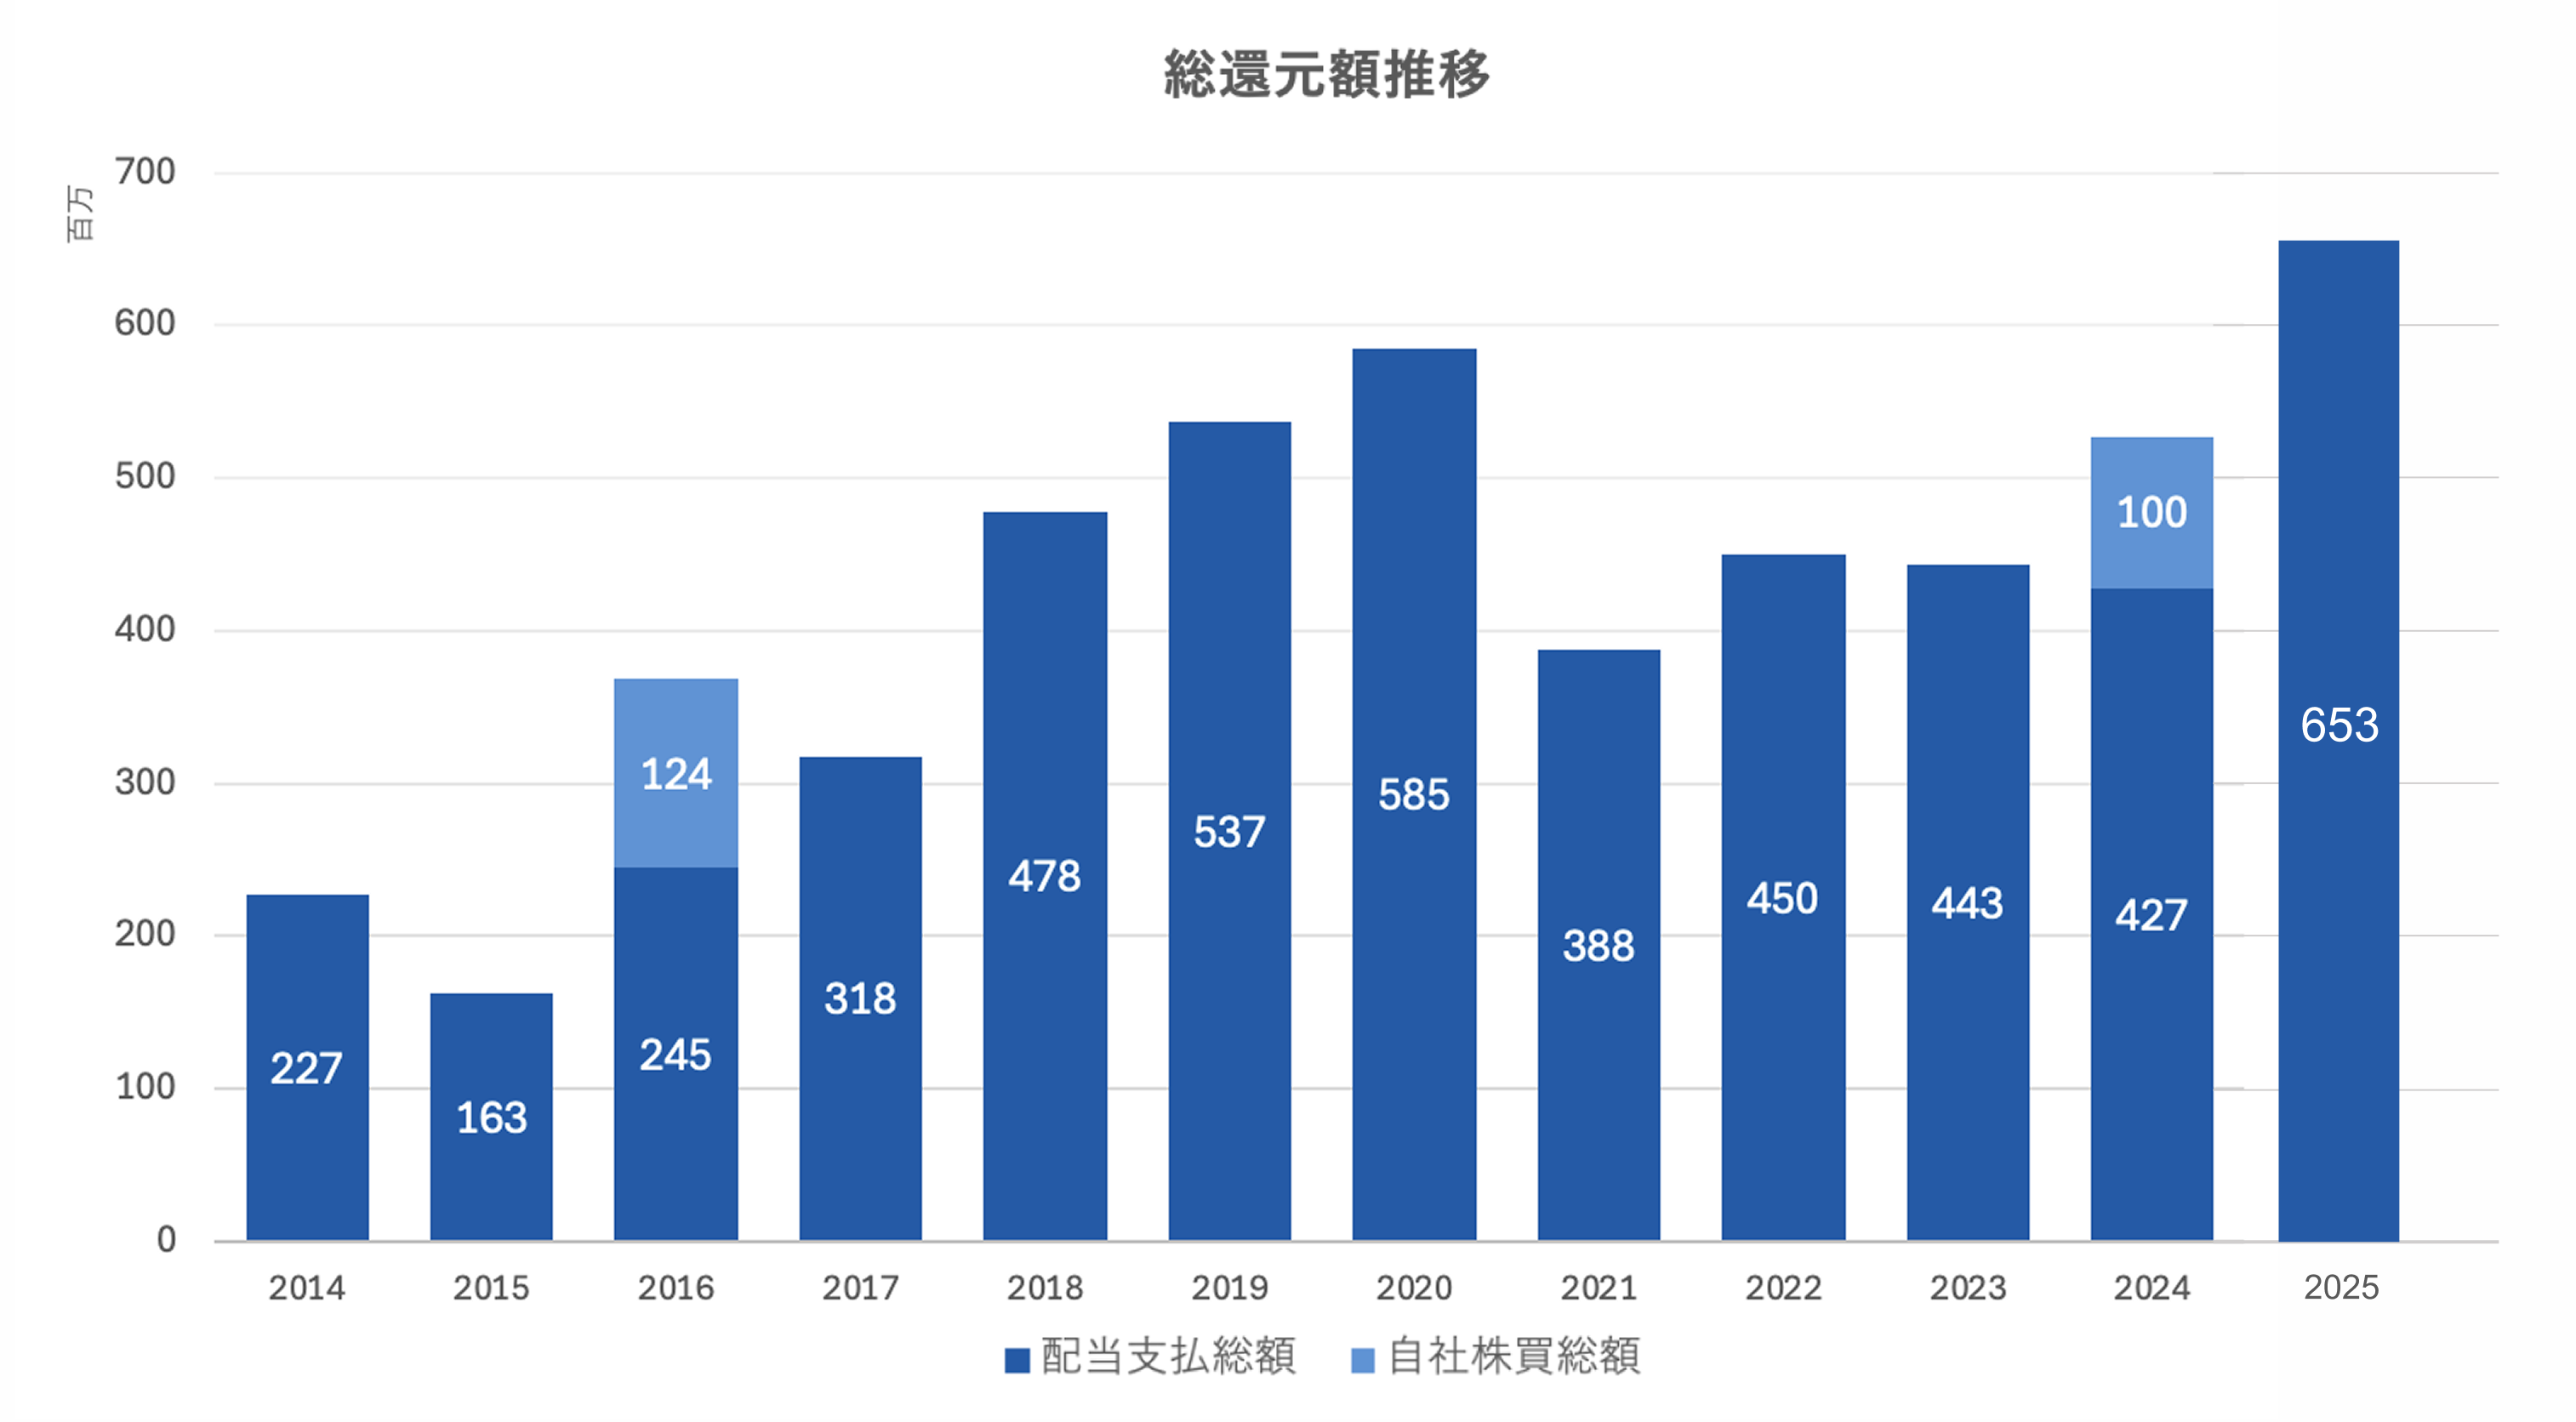
| FY2024 | 37,600 | 99,794,400 yen |
| FY2016 | 122,200 | 123,817,000 yen |
Trend in Total Shareholder Returns
Shareholder Benefits
Shareholder benefits are described on the Shareholder Benefits page.
Disclaimer
Statements contained in the materials on this website regarding the Company's current plans, strategies, beliefs and the like that are not historical facts are forward-looking statements concerning future business performance and the like, and involve risks and uncertainties. Please be aware that actual results may differ from these forecasts due to various factors.